HANS PALACIOS
Pipeline Developer / CG Generalist
R&D: D3.JS Design Tech Interoperability
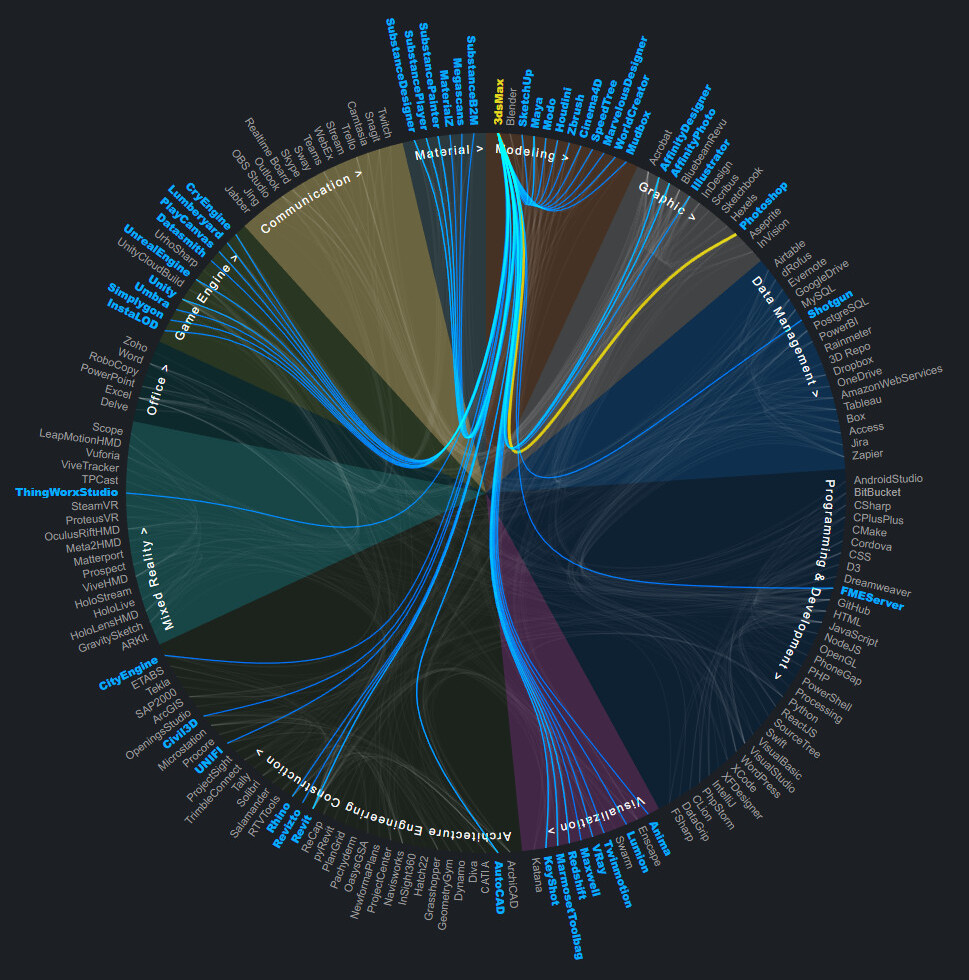
This is a project that I developed for a school assignment to merge data visualization and interactivity through a web site and application design. Using D3 JavaScript libraries, the dashboard aims to provide a map of interoperability among software that I use and how data can migrate from one to another. The interactivity in this interface looks to provide a user greater control of the information being sought after and a dynamic feedback loop.
Link to interactive site: https://morphingdesign.github.io/d3_DesignTechInter/
The following link is to a blog post that details the development process for this project and the live site:
https://morphingdesign.artstation.com/blog/YNWR/design-tech-interoperability-dashboard

